
When it comes to managing vacation rentals, few topics spark more debate among property owners than pricing, occupancy, and expenses. Many owners reviewing a monthly statement will ask, “Why are my expenses so high?” or “Aren’t low-value bookings costing me money?” It’s easy to assume that higher occupancy means higher costs, or that filling a gap with a discounted booking is a losing proposition. But assumptions can be costly. Real-world, long-term data tells a different story, one where strategic pricing, even for bookings with slim or no margins, reduces losses, improves cash flow, and helps position a property for better platform ranking and future high-value stays. This analysis takes you inside a two-year dataset from an average, mid-market vacation rental to show exactly how occupancy, revenue, and expenses interact, and why some of the most profitable months include bookings many owners would normally reject or not be priced to even have the possibility of accepting or declining.
After nearly five years managing properties, I’ve heard the same questions from new and experienced owners alike:
- Why are my expenses so high?
- I don’t want low-value bookings, they cause more wear and tear.
- I lose money when nightly rates are too low.
Until recently, my insights came from running periodic reports and observing the data in smaller increments. This time, I assembled a detailed, 24-month analysis for a single property to uncover the patterns that casual observations can’t capture.
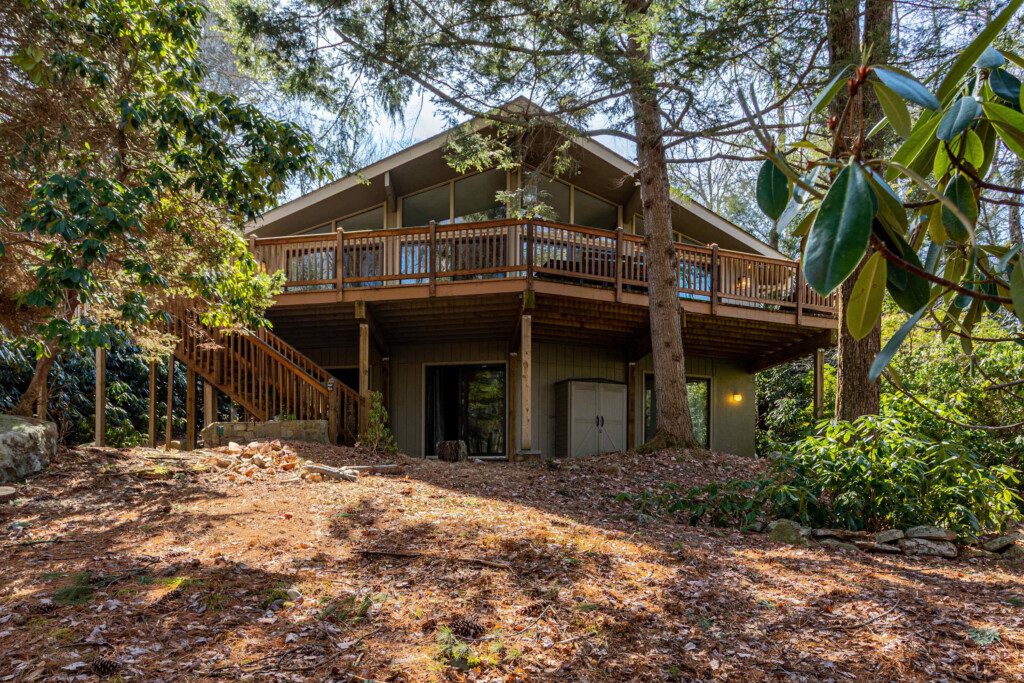
The property in this case study is a four-bedroom, two-bath home, roughly 1,800 square feet, without major luxury features. It has a shuffleboard table, one arcade game, and no hot tub—making it an excellent “average scenario” for understanding typical performance.
Fixed Expenses
Fixed expenses are the baseline costs you pay whether the property is booked or not. These include the mortgage, insurance, taxes, and recurring operational costs such as utilities and software fees. For this analysis, I’m focusing on the largest recurring items:
- Mortgage: $1,700/month
- Electricity (monthly average): $300/month
- Internet: $125/month
This home runs on a well pump and septic system, so there are no water or sewage charges.
To put the electricity estimate in perspective, I compared it to another property we own—a 3,000-square-foot home with mini-split AC and heating, oil baseboards, and propane for hot water and cooking. That larger home averages about $460/month in combined utilities. Given the 1,200-square-foot size difference, it’s reasonable to expect the 1,800-square-foot property in this case study to run proportionately lower, landing near the $300 mark.
A common misconception: many owners believe that more occupancy automatically drives up utility costs. My two years of property data says otherwise. Whether the house is occupied or vacant, monthly fluctuations in utilities are driven far more by seasonal temperature changes than by guest activity. In other words, heating in the middle of winter is the primary cost driver, not the number of nights booked.
The 30-month electricity data below clearly illustrates these seasonal trends, showing predictable peaks and dips that align with weather patterns, not occupancy rates.
Below, you’ll find a graph illustrating electricity expenses for a home over 30 months, highlighting these seasonal trends.

Seasonality and Utility Costs
The data shows one clear truth; seasonal temperature changes, not occupancy, are the primary driver of utility costs. Winter months, especially December, see the highest electricity usage as heating demand spikes.
For example:
- Dec 2023: 39% occupancy, $19.24/day electricity (well above the $8.34 30-month average)
- Dec 2024: 83.87% occupancy, $16.39/day electricity; despite nearly doubling booked nights, costs fell by about 15% due to milder weather compared to the prior December
- Mar 2025: 100% occupancy, $7.71/day electricity — actually below the long-term average
The highest bills occur in December, driven by colder weather and holiday heating demands. However, this period also tends to bring some of the highest rental rates of the year, so strong revenue often offsets the increase in utility expenses.
Two key insights emerge from the 30-month dataset:
- March–November (generally warmer months) offers the best window to drop last-minute minimum pricing since electricity costs are lower.
- Even with little or no occupancy, electricity averages around $100/month for a property of this size, meaning some costs remain fixed regardless of bookings.
Over the observed period, monthly electric bills ranged from as low as $74 in warmer months to as high as $540 during peak winter. The chart below visualizes these fluctuations, making it clear how strongly weather patterns shape utility expenses.

Fixed vs Variable Costs:
The seasonal utility trends highlight an important point: certain expenses are unavoidable, whether the property has guests or not. These fixed costs form the baseline the property must cover just to break even.
Using the earlier figures, this property requires $2,125 per month (about $25,500 annually) to cover the mortgage, internet, electricity, and other recurring expenses. That equals $69.86 per day, booked or not. If a date passes without a booking, the revenue opportunity is gone, and that day’s cost must be covered out of pocket or absorbed by other bookings, making those nights less profitable.
Variable costs, such as household supplies, minor repairs, and appliance maintenance, are far less predictable. While some owners believe that higher occupancy or low-value bookings significantly increase expenses, the data shows otherwise. Occupancy only slightly influences utilities, and variable costs are not strongly tied to occupancy rates.
To put these costs into perspective, here are some average figures for a typical four-bedroom home without a hot tub, illustrating how utility and household expenses break down on both booked and non-booked days.
For a four-bedroom home without a hot tub, utility costs average $36.98 per booked day, or $16.46 per day regardless of occupancy. (Based on 3,000 sqft)
For a four-bedroom home without a hot tub, household expenses average $15.22 per booked day, and about $8 per day whether booked or not. (Based on 1,800 sqft)
This is why the warmer months (March through November) present such a strong opportunity to fill last-minute openings at reduced rates. With lower utility expenses and fixed daily costs still accumulating, even a modest booking helps offset what would otherwise be a complete loss.
Next, we’ll examine the numbers on variable expenses and compare them to the revenue your property generates after deducting cleaning, HOA, and management fees.

Occupancy and Owner Revenue
The graph above compares owner revenue by billing cycle alongside occupancy rates for a property we relaunched in July 2023. This home had previously been underperforming under different management, making it a valuable case study for understanding how occupancy impacts revenue.
The key takeaway: with only three exceptions, higher occupancy correlates strongly with increased owner revenue. Specifically, when occupancy exceeds 50 percent, there is a 79% greater likelihood that the property will cover its fixed expenses.
The three exceptions include:
- Two billing cycles with occupancy over 50% where revenue fell short of the break-even point
- One billing cycle with occupancy below 50% where revenue exceeded break-even significantly
Out of 24 total months, 11 months had occupancy at or above 50% and generated owner revenue exceeding $2,125. This data clearly demonstrates that higher occupancy almost always translates to higher revenue, making it a critical factor in property profitability.

Booking Frequency and Profitability
The second graph illustrates the relationship between owner revenue and the number of stays each month. A common misconception is that “more turnover means less profit for the owner.” However, the data firmly disproves this.
There is a strong positive correlation between the number of stays and overall profitability. When a property records five or more stays in a month, there is an 89% chance it will meet or exceed the $2,125 revenue target (for this example). Conversely, months with fewer than five stays reach that target only about 7% of the time.
This clearly shows that increasing booking frequency is one of the most effective ways to ensure consistent profitability.

Does More Occupancy Mean Higher Expenses?
A common concern is that increased occupancy leads to more wear and tear—and therefore higher expenses. While it’s true that more use can cause some additional wear, the data tells a different story.
According to the graph, when occupancy reaches 50 percent or higher, there is a 71% chance that average daily expenses will be below the overall 24-month average of $15.22.
Moreover, months with occupancy of 50% or greater have a 64% chance of total expenses falling below the 24-month average of $262.07.
It’s worth noting that expenses tend to rise modestly during the shoulder seasons, spring and fall; due to our proactive approach of conducting full inventory counts and restocking supplies. While this results in higher costs during periods of generally lower revenue, this strategic restocking ensures the property remains well-maintained and fully prepared for peak seasons. In the long run, this practice helps prevent unexpected expenses and supports consistent guest satisfaction.
Another key observation is that when we first took over management of this property, expenses were unusually high due to neglected upkeep and worn items—something common when taking on existing rentals.
For clients reading this, you can see how expenses tend to decrease over time as we maintain proper stocking and upkeep, ensuring your property is well-prepared to handle anticipated bookings.

The Value of Low-Value Bookings
A common argument I hear is, “Low-value bookings aren’t worth it because they might cost me money.” However, letting your property sit vacant is a guaranteed loss, given the fixed expenses we discussed earlier.
It’s far better to make a modest $40 profit, covering all fixed costs and most or all variable expenses, than to lose $140 by having two empty nights due to fixed daily costs accumulating in our example. Many industries use this approach. Think of big retail, where clearance sales are a tactic to move inventory that did not sell as expected and to reduce losses. Restaurants take a similar approach with “specials,” which are often created to use up surplus ingredients before they spoil. Airlines and our big brother, the hotel industry, use similar pricing strategies by lowering rates to fill vacancies. Often, the best time to book a flight or hotel is within 1 to 2 weeks of the stay, when some of the best rates are available.
Typically, these lower-value nights are offered only when the property hasn’t booked within the usual window or when demand is substantially lower than normal. They usually fall on weekdays; Sunday through Wednesday; which have about a 10% or lower chance of booking otherwise, or on select weekends with incredibly low demand.
This doesn’t mean you should give these nights away for free, but securing some revenue is always better than none. Most “low-value” bookings; defined here as between $80 – $130 net ADR after cleaning and HOA fees; do not drive up expenses.
In fact, the data shows no correlation between low-value bookings and increased expenses. Over time, as the listing and property mature, both low-value bookings and expenses tend to decline together.

The Power of Last-Minute, Lower-Value Bookings
The key takeaway is that welcoming last-minute, lower-value bookings to fill gaps in your calendar ultimately puts more revenue in your pocket as an owner.
Over a 24-month period, 34 out of 110 stays had a net ADR of $130 or less (after cleaning and HOA fees). These bookings accounted for 175 nights and generated an additional $14,699.13 in revenue—averaging about $612.46 extra per month. This amount is nearly enough to cover seven full months of fixed costs.
During those 24 months, the owner earned a total of $53,947.04. Without these lower-value bookings, revenue would have been only around $39,247.91; possibly a bit higher if some dates had been booked last minute at slightly better rates. Still, thanks to these “low-value” stays, the owner consistently covered both fixed and variable expenses.
Our data further shows that when there was at least one booking with an ADR of $130 or less, the owner met or exceeded fixed costs 56% of the time. With two or more such bookings, the likelihood increased to 70%, and with three or more, the owner was 100% certain to reach or surpass the break-even target.
To put this into perspective, the property in our example carries fixed expenses of $69.86 per day; costs the owner pays regardless of bookings. Securing a low-value booking that covers most or all of that daily cost is far better than letting the house sit empty and absorbing the full fixed cost. Even a modest profit from these bookings helps offset unavoidable expenses and boosts overall financial performance.
Consider this: if you have two vacant days, you lose $139.72 in fixed costs. A reasonable booking generating at least $100 profit per night would bring in $200 total, meaning you still make about $60.28 after covering all expenses. I’d much rather have that positive cash flow than burn through the full loss.
It’s also about minimizing losses. If a booking generates $125 in revenue but falls short of the $139.72 fixed cost by $14.72, losing that smaller amount is far better than losing the full fixed cost. Since additional bookings don’t significantly increase variable expenses, there is essentially no downside to filling last-minute vacant nights.
Finally, and perhaps most importantly, booking platforms favor listings with higher engagement—more bookings, views, and occupancy. Each day your property sits empty, you not only lose revenue but also risk losing search visibility. Securing any booking to cover expenses helps maintain and improve your listing’s long-term performance.
Additionally, what if the guest who books that low-value stay returns during peak season, or shares their positive experience with friends and family, highlighting the great value they received on a midweek, last-minute booking? The potential upside from these situations is often overlooked but can be significant.
That said, this strategy should be balanced with efforts to maximize revenue by optimizing pricing for dates with higher demand. Not all dates are equal, so pricing should be carefully adjusted to capture peak season rates while still filling gaps during slower periods.
Key Points
- Fixed costs like mortgage, utilities, and insurance must be covered regardless of occupancy, making consistent revenue essential.
- Utility expenses are driven more by seasonality than by occupancy levels.
- Variable costs, such as supplies and repairs, do not increase proportionally with more bookings.
- Higher occupancy and increased booking frequency strongly correlate with greater owner revenue and profitability.
- Last-minute, lower-value bookings rarely increase expenses but significantly help offset fixed costs and reduce losses from vacant nights.
- Booking platforms reward listings with higher engagement, so filling every possible night improves search visibility and long-term listing performance.
- Optimizing pricing requires balancing lower rates for slow periods with maximizing revenue during high-demand dates.
Closing Thoughts
Understanding the true relationship between occupancy, expenses, and revenue is essential to maximizing your property’s financial performance. While concerns about increased costs from “low-value” or frequent bookings are common, the data shows these fears are largely unfounded. Accepting last-minute bookings; especially during slower periods; can mean the difference between breaking even and turning a profit.
Every vacant night is a lost opportunity to cover fixed costs that don’t disappear. By strategically filling your calendar with even modestly priced stays, you reduce losses, improve cash flow, and enhance your listing’s visibility on booking platforms. Higher engagement through more bookings, views, and occupancy improves your chances of attracting future guests and maintaining strong search rankings.
Additionally, the value of these lower-rate bookings goes beyond the immediate revenue. Guests who book midweek, last-minute stays and enjoy their experience may return during peak seasons or recommend your property to friends and family, creating significant long-term benefits that are often overlooked.
Coupled with smart pricing strategies that maximize revenue during high-demand periods, this balanced approach builds a resilient, year-round income stream for your property. Moving beyond assumptions and embracing occupancy optimization; not just rate maximization, can transform your rental’s profitability and growth potential.